SIRI PETTERSEN STRANDENES
B.1.1.1 Global seaborne transport
Shipping is essential to the functioning of the global economy and the related international merchandise trade. Shipping facilitates trade by moving goods from production to consumption sites.
Raw materials and finished goods are traditionally the main cargoes in international trade. They include foodstuffs, chemicals, oil, whitegoods, clothing, cars etc. In later decades, trade in intermediate goods for further processing has grown steeply and in parallel with the so-called fragmentation of the production processes. Fragmentation is the splitting of the production process between several locations to produce each component where the production conditions and costs are most favourable. International trade in these components constitutes an important share of seaborne trade.
World seaborne trade rises with economic growth. Economic growth is measured by world gross domestic product (GDP) and the seaborne cargo flows show this growth.
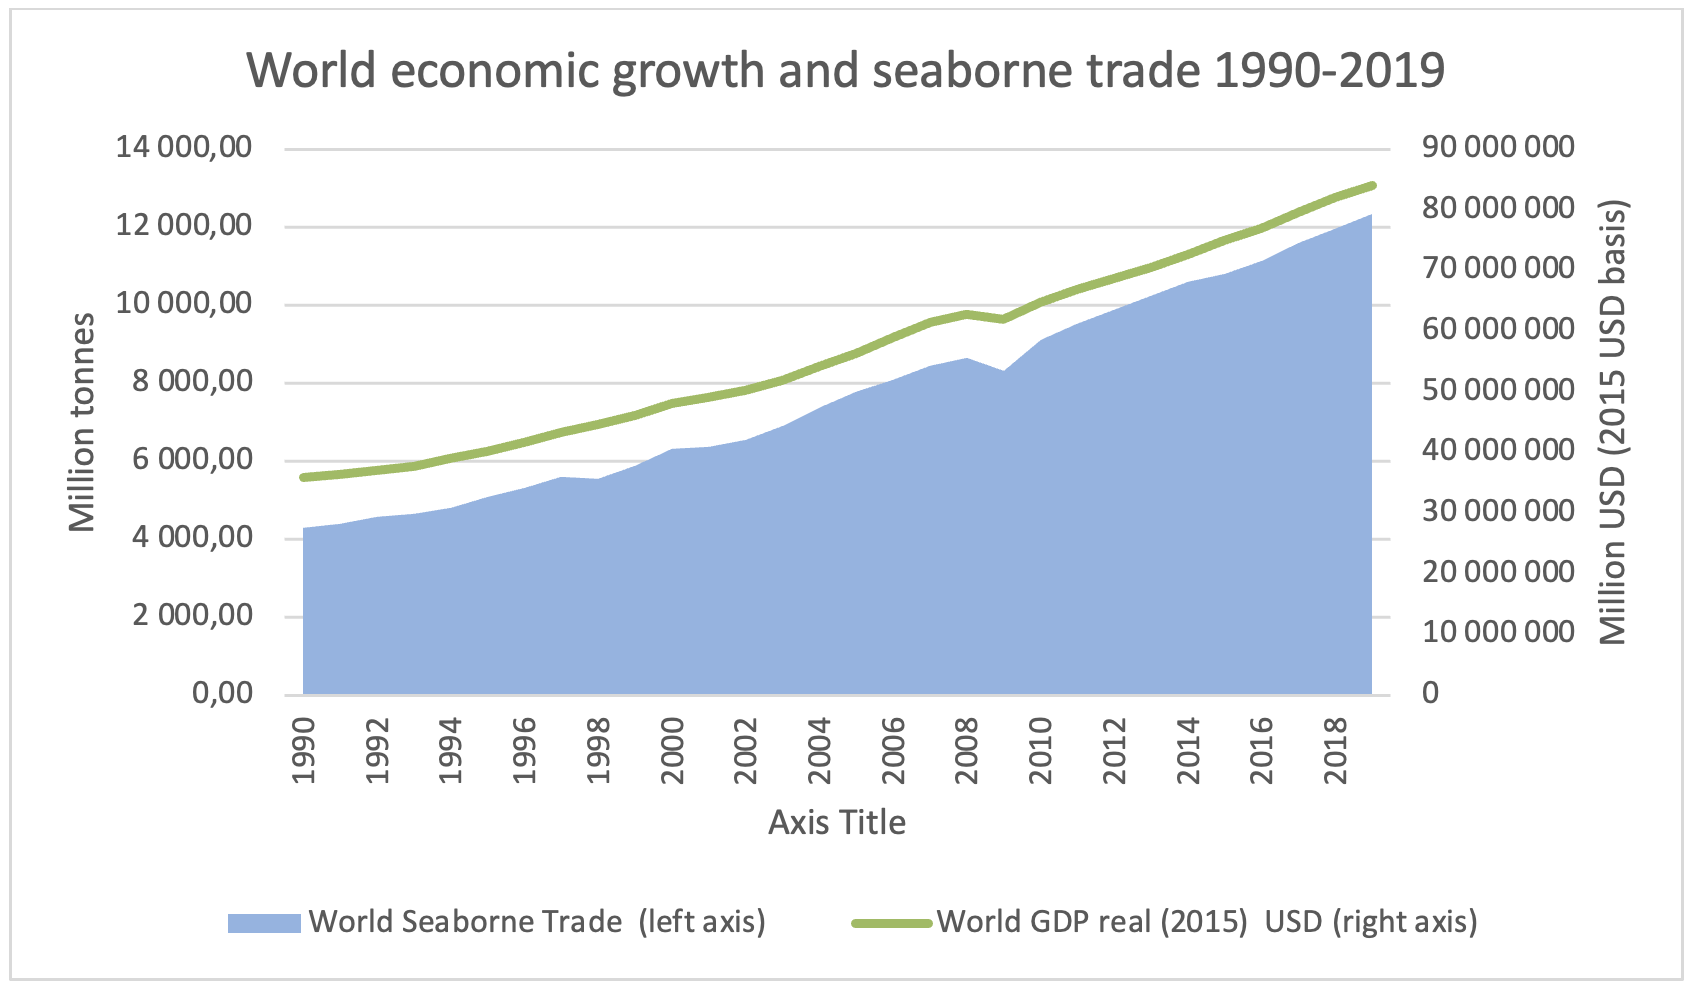
Sources: Based on data from (1)[1] and(2)[2]
[1] Clarksons Shipping Intelligence London 2018. Updated 2018 https://sin.clarksons.net/
[2] http://unctadstat.unctad.org/wds/TableViewer/tableView.aspx
B.1.1.2 Major cargoes in seaborne trade
The major commodities in seaborne trade are crude oil, oil products, liquefied gas, chemicals, coal, iron ore, grain, phosphate, alumna, plus intermediary and finished goods. Finished and intermediary goods move in containers, whereas the other main cargoes move in bulk. That is, these cargoes are loaded directly into the hull of the vessel. In addition, special shipping segments employ vessels specially designed to transport cargoes like cars, refrigerated cargoes and heavy cargoes. The offshore fleet supports offshore oil production installations. Offshore emerged as an important shipping segment with the growth in offshore oil and gas exploration.
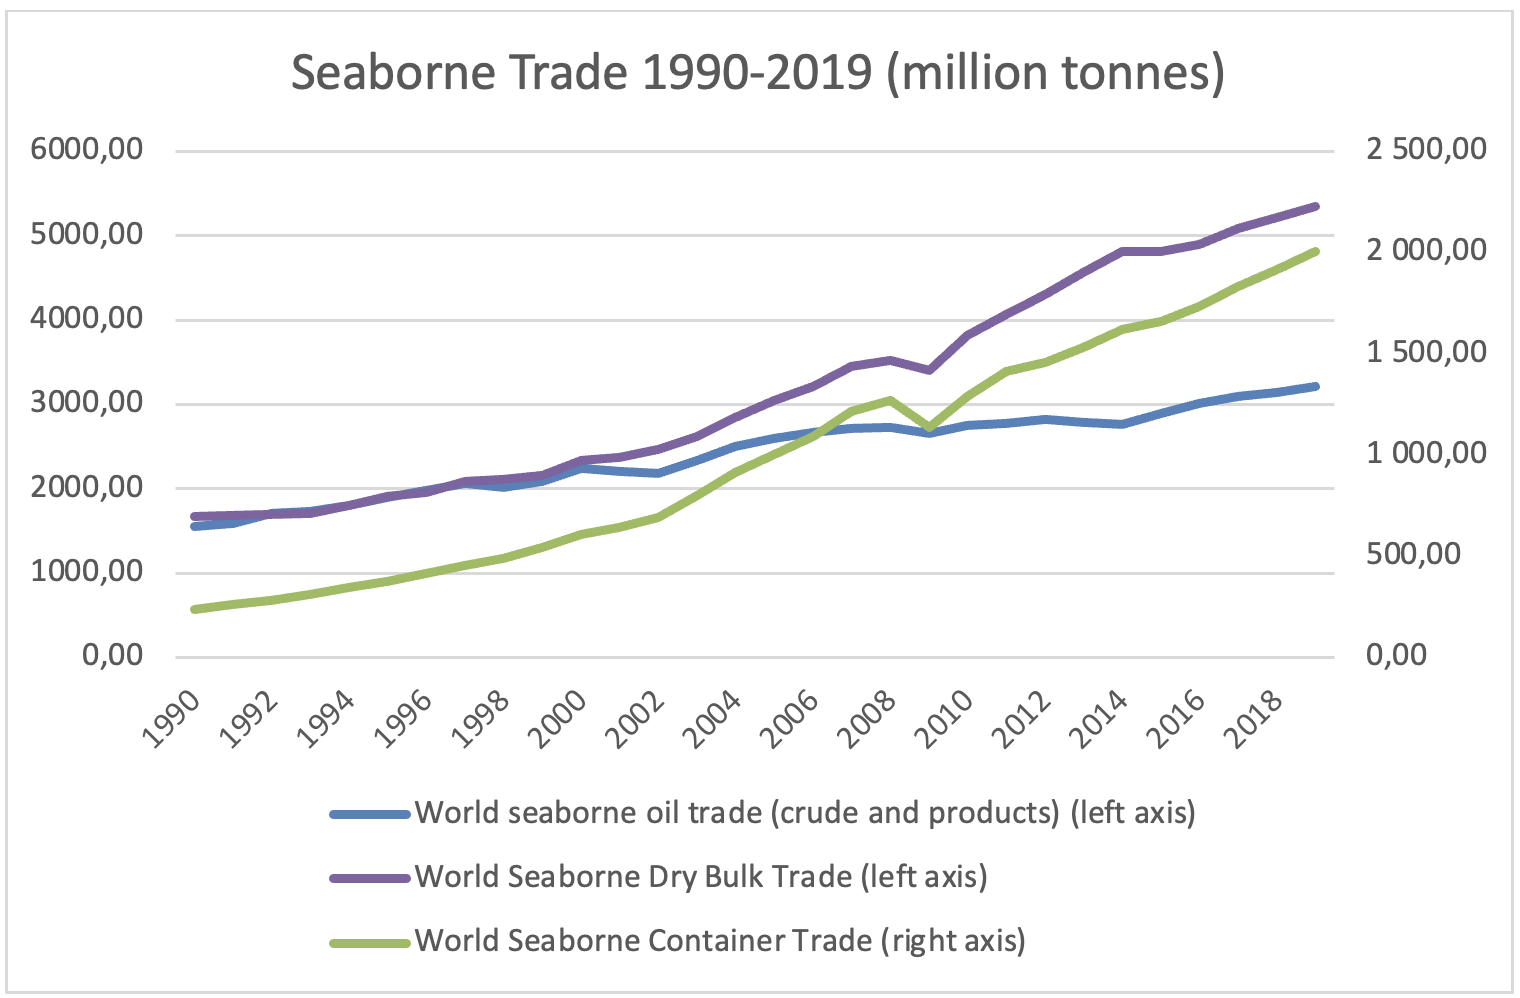
Source: Based on data from Clarksons Shipping intelligence London 2018 (1)
Transport costs have fallen over the years. The reduced transport cost partly explains the strong growth in interregional trade since World War II. Stopford (3) points out that oil freight amounted to 30% of the value of a barrel of Arabian Light Oil in 1960. In 2004, the freight was less than 5% of the value of the oil. However, this relationship varies with both oil price fluctuations and freight rate variations. The costs of transporting intermediary and finished goods have also fallen dramatically, mainly because of containerisation and the accompanying rise in cargo handling efficiency.
|
| Trade costs | ||
Cargo type | Route | 2010 | 2015 | 2017 |
Container USD/TEU* | Shanghai - Europe | 1771,00 | 620,00 | 876,00 |
Iron ore USD/tonne | Tubarão - Rotterdam | 13,66 | 5,55 | 7,84 |
Crude oil USD /barrel | West Africa – US Gulf (VLCC) | 1,62 | 2,35 | 1,21 |
Crude oil USD /tonne | West Africa – US Gulf (VLCC) | 11,87 | 17,17 | 8,81 |
* TEU (Twenty-foot equivalent unit) One TEU refers to the dimensions of a twenty-foot container and is used as a standard unit of measure in container shipping.
Source: Calculated based on information from (1)
B.1.1.3 Sailing areas
The major deep-sea trades cross the Atlantic or the Pacific in the northern hemisphere and reflect the location of the highly developed economies. The developed economies engage most in international trade. The container and car trades are typical for this trading pattern. Trading patterns of course change over the years and the main changes since the 1990s are the rising share of world trade back and forth to China and the growth of the inter-Asian trades.
The trade patterns differ among the main bulk cargoes since raw materials, such as crude oil, coal, iron ore, grain, phosphate, and alumna are located in different areas across the globe. Some of the larger trades like iron ore from Brazil and coal from Australia originate in the southern hemisphere. UNCTAD[1],[2]. calculates that 42% of world seaborne trade originates in Asia, 17% in Europe, 21% in the Americas, 13%in Oceania and 7% in Africa.
B.1.1.4 Global shipping companies
The global nature of shipping and the shipping companies is best illustrated by a specific example. In 2017 Star Bulk Carriers Corp. took delivery of the new bulk carrier MV Star Ariadne and registered her in Liberia. Star Bulk Carriers Corp. is a large shipping company
incorporated in the Marshall Islands with executive offices in Greece and Cyprus. Star Bulk Carriers Corp stocks trade at the Nasdaq Global Select Market in USA and at the Oslo Stock Exchange in Norway[1]. Their Manilla based, partly owned subsidiary Star Ocean Manning Philippines Inc[2]. provides and manages crew for Star Bulk Carriers Corp.
MV Star Ariadne was built at the Chinese Shanghai Waigaoqiao yard and is classed by France based Bureau Veritas (BV)[3] . The vessel is insured by the UK P&I Club[4]. Star Bulk Carriers Corp. does not own the vessel directly, but leases her from CSSC Leasing, a leasing arm of China State Shipbuilding Cooperation. The ship is equipped with an MAN B & W engine from the German / Danish engine manufacturer.
Examples of MV Star Ariadne’s assignments are one voyage lifting 190 000 tonnes iron ore from Tubarão in Brazil to Qingdao in China followed by one sailing with iron ore from Port Hedland in Australia to Qingdao after a ballast[5] trip from Qingdao to Port Hedland. The charterer CARGILL, a US company with global presence,[6] paid 13,20 USD per tonne cargo for the first transport service. The next trip was chartered by the Australian FMG[7] at 9,10 USD per tonne cargo[8].
B.1.1.5 Ship operations
Companies in the shipping industry may choose widely different organisational structures in ship owning and operation Firms operating vessels on scheduled routes, typically container vessels, announce the schedule up front and then work to fill the cargo carrying capacity of the vessel on each leg of the trip.
In bulk shipping, there are three main alternatives:
- A ship owner may choose to invest in ships and let other firms operate the vessels. Then the ship owner lets his vessel on a so-called demise or bareboat charter for several years. This resembles a financial investment since the owner finances the vessel but does not operate it nor provide the crew. Hence, the responsibility for the crew may not always rest with the owner of the vessel.
- Ship owners may charter the vessel out on a time charter for some months or several years. If so, the ship owning firm operates the vessel, provides crew, and secures maintenance, whereas the hiring firm directs the vessel’s sailing and decides on what cargoes the vessel carries.
- The third alternative is the fully integrated shipping firm that finances the vessel, provides crew and maintenance and finds cargoes for the vessel to lift by agreeing with a cargo owner on a voyage (or spot) charter for a specific trip or voyage., The shipping firm offers the vessel in the market for single cargo trips or makes an agreement with a cargo owner for a few consecutive voyages.
Shipping companies differ widely in size from small entities operating a few ships to large integrated companies operating a large fleet of vessels. The large ship owning companies often operate diverse types of vessels and offer transport services in several segments of the shipping industry. Examples include Maersk[1], the world largest container ship operator and Wallenius Wilhelmsen Logistics[2], the market leader in car carriers.
Some firms in the shipping industry specialise in technical or commercial management without investing in ships. Technical management implies providing crew, maintenance, and ensuring that the operations satisfy rules and regulations. These firms charter vessels on bareboat charters and let them out on time charters. Commercial management, on the other hand, implies securing cargo and thus the revenue from operating the vessel. In this case, the firms charter vessels on time charters and fix them on voyage charters.
We also see combinations of these operational alternatives within individual shipping companies. The firm may choose to have a mix of vessels owned and operated and vessels hired in from other firms on either bareboat or time charters.
To further underline the diversity, we point at the many “one-ship” firms that may own only one vessel. Such “one-ship” firms typically are subsidiaries of a holding company. The holding company may register vessels, and the ship owning “one-ship” firm in different countries.
B.1.1.6 A global market for officers and crew
The Baltic and International Maritime Council (BIMCO) estimated the seafaring workforce in 2015 to be 1 647 500 persons of whom 774 000 are officers and 873 500 ratings[1].
The same publication estimates the demand for officers in 2015 at 790 500 and for ratings 754 500, implying that there is a 2.1% shortage of officers and a 15.8% surplus of ratings. The shortage of officers is expected to increase to 18,3 % by 2025. A more recent assessment by(4) on the other hand anticipated that the officer shortfall will disappear by 2024.
The top five supply countries are China, the Philippines, the Russian Federation, Ukraine, and India. Hence, the global aspect lies not in the number of countries supplying seafarers but more in the fact that these seafarers sail in vessels flying flags of the many open ship registers of the world, i.e., the many registers that do not require nationals on board the vessels. Several firms specialise in recruiting seafarers for example: Naess Shipping Philippines INC.[2], Wallem Group[3] Hong Kong, Wilhelmsen Ship Management[4] Singapore and OSM Maritime[5] Norway and several websites publicise jobs for seafarers, for example Seamanjobsite[6]
B.1.1.7 Manning of vessels
In the 1960s and 1970s, the introduction of open ship registers led to national crews being replaced by crews from low labour cost countries, thereby turning the labour market for seafarers away from the national markets of the ship-owning firms.
Crew cost is still the main element of vessel operating costs, whereas fuel is the main component of vessel voyage costs. Shipping firms seek to reduce operating costs by new technology. Rationalisation and automation have dampened the effect of the rising crew cost after World War II and this resulted in fewer seafarers on board. However, seafarers stay on board for shorter periods than before, and thus, the number of seafarers needed to operate the vessels did not shrink proportionally.
Older vessels may have larger crews than newer vessels resulting from the higher need for maintenance and repair. This difference may also reflect less automation in older vessels.
Hence, changes in the average age of the fleet may influence the demand for the crews. The heavy contracting in the boom stopped by the financial crisis in 2008 led to delivery of several new vessels and this increased the share of modern vessels in the world fleet, thus reinforcing the change in demand for crews towards fewer but more educated seafarers.
Further information on the recruitment of seafarers is available in Chapter 4.1.1.
Ship type | Officers | Ratings |
Tankers* | 7 - 13 | 8-19 |
Dry cargo carriers* | 8-10 | 8-14 |
Container vessels | 8-10 | 8-14 |
LNG carriers | 9-14 | 12-18 |
Offshore PSV** size vessels | 6-9 | 5-7 |
*The highest on the largest vessels. ** PSV=Platform supply vessel
Source: (4)
B.1.1.8 References
1. Clarksons. Shipping Intelligence Network London2018 [updated 10 28.
2. UNCTADStat. 2018 [updated 10 28.
3. Stopford M. Maritime Economics. London: Routledge; 2009.
4. Drewry. Ship operating costs. Annual Revies and Forecast, Annual Report 2019/20. London: Drewry Maritime Research; 2020.
[1] http://www.ics-shipping.org/docs/default-source/resources/safety-security-and-operations/manpower-report-2015-executive-summary.pdf?sfvrsn=16
[2] http://naess.com.ph/our-services/
[3] https://www.wallem.com/about/
[4] https://www.wilhelmsen.com/ship-management/
[6] https://seamanjobsite.workabroad.ph/.
[1] https://www.maersk.com/solutions/shipping
[2] https://www.walleniuswilhelmsen.com/about
[2] http://www.starocean.com.ph/
[3] https://group.bureauveritas.com/
[5] Sailing in ballast is sailing without any cargo
[6] https://www.cargill.com/about/company-overview
[8] https://sin.clarksons.net/
[1] https://unctad.org/en/Pages/Publications/Review-of-Maritime-Transport-(Series).aspx
[2] https://unctad.org/en/pages/PublicationWebflyer.aspx?publicationid=2245